
Economics of Financing a Project
A Rooftop Solar Project Financed Using a Loan
Part 1 of this series looked at cash flow and return on investment for purchase of an example solar photovoltaic (PV) system. This article looks at the economics of financing a similar system. The information on financing a PV system via a loan is applicable to other green projects, such as installation of an electric heat pump system.
Part 3 of this series will look at leasing, which is feasible for solar PV systems that are relatively easy to install and remove from a house. For other home energy efficiency equipment, such as an electric heat pump system, leasing is not feasible because installation is more complex and must be fully integrated with the home heating and cooling system.
Example System
In Part 1, a 7.2 kW solar PV system was used as an example. For this article, a different capacity system will be used based on a free online tool, Google’s Project Sunroof.
This tool can provide an estimate for a PV system on any address currently in its database. Here’s an example for a sample house:
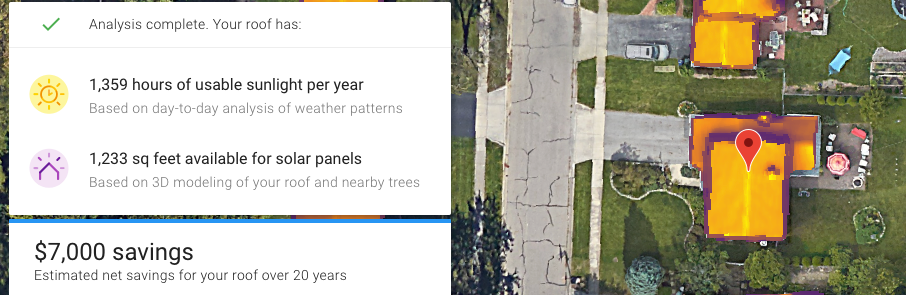
The hypothetical system size provided by the tool has the following characteristics:
- 8.8 kW system (sized to offset 98% of annual electric usage)
- Purchase price: $25,707
- Federal tax credit: 26% of purchase price ($6,683)
- Annual electric usage: (estimated in the tool, but not visible)
- Electric cost: (estimated in the tool, but rate per kWh not visible)
- Approximate monthly electric bill: $100 (this can be adjusted in the tool)
- System assumed life: 20 years
The tool allows you to adjust the average monthly electric bill, but it doesn’t allow you to make adjustments to its underlying assumptions. Even with this limitation, it is an excellent way to get an idea of what a system might look like for you. The data it provides is also useful to have if you decide to move forward and contact a vendor for a proposal.
Financing Through a Loan
When you get a loan from a financial entity, you pay it back over time based on a specific annual interest rate. Since you’re paying back the amount of the loan (the principle) and interest, the total amount you pay will be higher than what you’d pay via a simple purchase of the system. The loan, however, allows you to proceed with a project without an initial large cash outflow.
The Google tool makes the following assumptions for a loan:
- 20 years (240 months) loan duration
- 6.6% annual interest
- Principal: $19,000 (rounded value of purchase price minus the federal tax credit, $25,707 — $6,683 = $19,024)
The detailed output from the tool looks like this:
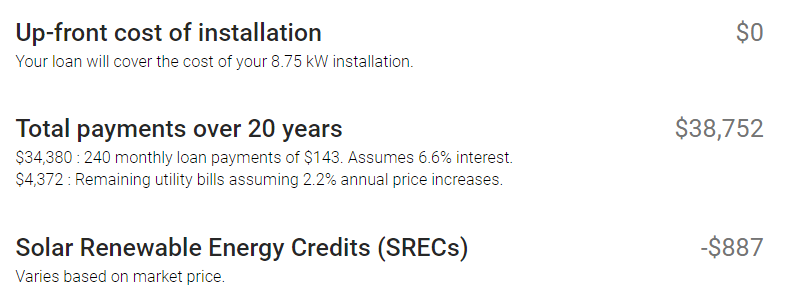
Let’s review these results.
- Google doesn’t show details of how the SRECs were calculated, but basically it is a credit per megawatt-hour (1,000 kilowatt-hours) of electricity that your system generates. [1] This will vary based on your location and applicable utility policies and regulations.
- Using an online calculator, I was able to duplicate the loan numbers in the Google tool. Over the life of the loan, you pay about $15,300 in interest.
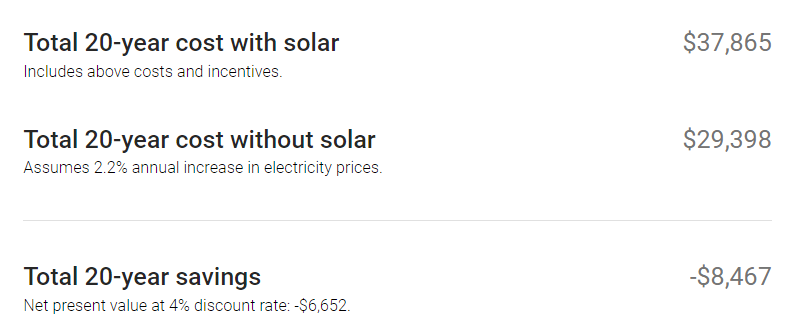
- The last figure from the tool for “Total 20-year savings” is a negative value, so there are no net savings from the solar PV system after 20 years. This is primarily due to the interest amount paid during the duration of the loan.
The cash flow diagram looks like this:
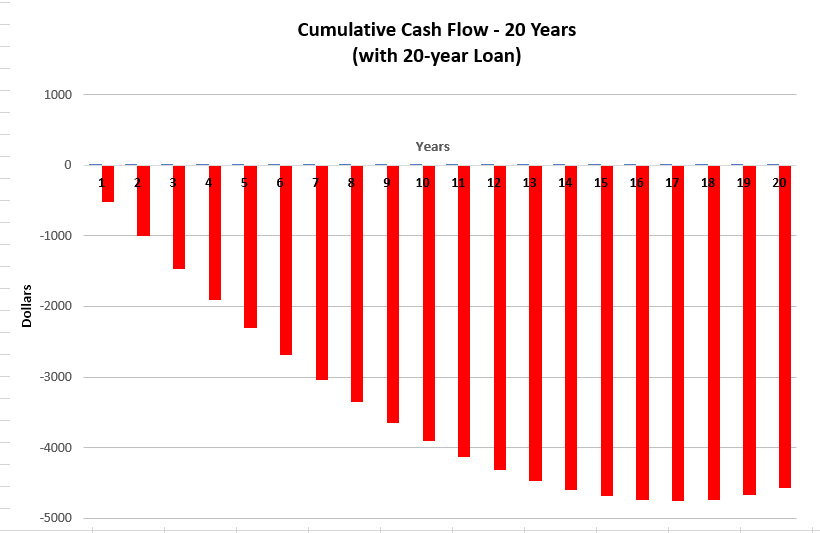
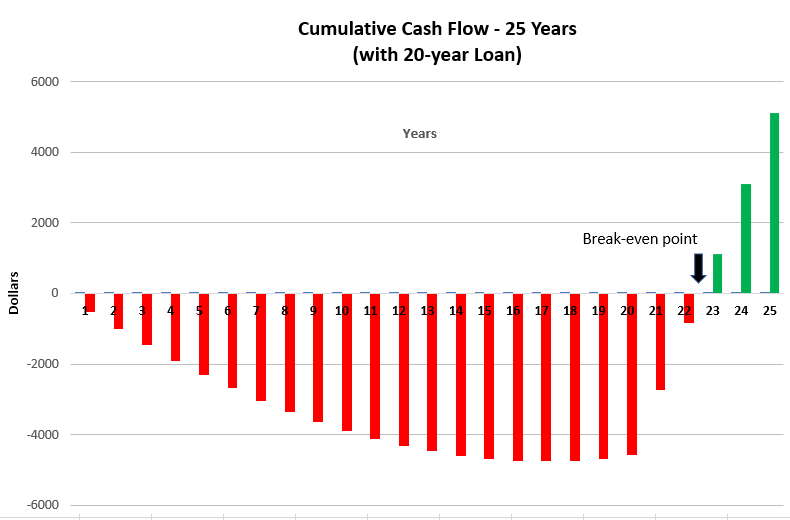
In year 18, the inflated monthly electric cost starts to exceed the monthly loan payment, so the project starts to become less cash flow negative. But at year 20, you’re still about $4,500 from break-even.
The loan is paid off in year 20, so for every successive year the system operates, you’ll be cash flow positive by about $1,800. That would cover the $4,500 in about 2.5 years. The financed project will break even in year 23.
Here’s the 25-year cash flow diagram:
Is This a Good Investment?
Being cash flow negative at the end of 20 years is not a good investment. The Google tool gives another indication in the results: “Net present value at 4% discount rate: -$6,652”
Net present value (NPV) is a financial calculation to determine today’s value of a future cash flow stream. A negative NPV is not a good investment. A positive NPV means the investment return is exceeding the “discount rate”, so it is a good investment. The discount rate is an annual percentage that you want the investment to exceed. It can be whatever value makes sense for you. For example, if you feel you could take the money for this project and earn 6% per year in stocks, bonds or some other investment, you can use that as the discount rate. (The Google tool defaults to 4%.)
Excel or any other spreadsheet can be used to perform an NPV calculation. You create a table of the cash flow for each year and apply the discount rate in the NPV formula.
I put the numbers in Excel and couldn’t duplicate the number in the Google tool, but I also got a negative value indicating this is not a good investment over 20 years. However, if you look at the investment over 25 years the NPV is positive, indicating a good investment.
The investment picture also changes based on the loan duration and interest rate. For example, if you did a 10-year loan at 5% interest, the cash flow diagram looks like this:
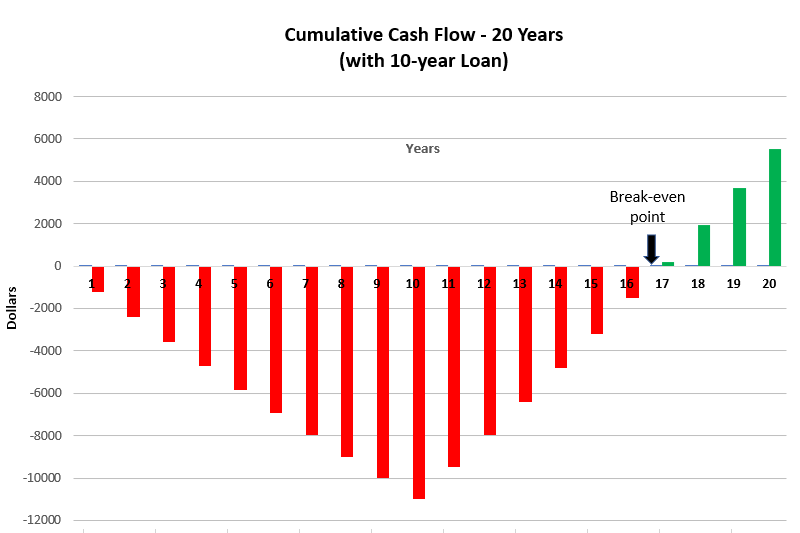
The investment has a positive NPV using a 4% discount rate.
Summary
There are many factors to consider when evaluating whether a financed solar PV is a good investment, including:
- Size and orientation of your roof
- Geographic location
- Financial incentives available (tax credits, rebates, etc.)
- Local electric utility rates (including expected increases due to inflation and other factors)
- Loan duration
- Loan interest
- Your ownership timeline and return on investment goal
Keep in mind, too, that as the cost of solar panels continues to drop, the investment picture also improves. Over the past 10 years, various sources estimate costs have dropped 70 to 90%. As solar power demand increases and technology improves, the cost will continue to follow a downward trend. It’s worth keeping an eye on these changes and periodically evaluating whether or not it’s a good investment for you.
[1] https://www.epa.gov/green-power-markets/policies-and-regulations#one