
Cash Flow and Return on Investment
Purchase of a Rooftop Solar PV System
This article examines the economic aspects of investing in green projects such as installing solar photovoltaic (PV) panels on your home or installing more energy-efficient air conditioning equipment. A framework is provided to look at such investments from a cash flow perspective and whether or not there is a reasonable payback on the investment.
This is the first article of a two-part series. Part 1 looks at a simple purchase example for a solar PV system. Part 2 will look at examples of the different ways solar PV projects can be financed or configured.
Example System
A 7.2 kW solar PV system will be used as an example. This system capacity might be applicable to a 2,000 sq. ft. home with natural gas heating, but many factors go into the specific sizing of an actual system.
If you’d like to get an initial estimate of the feasibility of solar PV for your home, Google has a useful tool: https://sunroof.withgoogle.com/
Before taking an initial look at the cash flow diagram, a diagram of the output of the solar PV system will illustrate why some simplified assumptions are needed in the investment analysis. The solar PV electrical energy output varies by time of year, as does the electrical consumption in a home. Units of electrical energy are kilowatt-hours (kWh). Here’s an example:
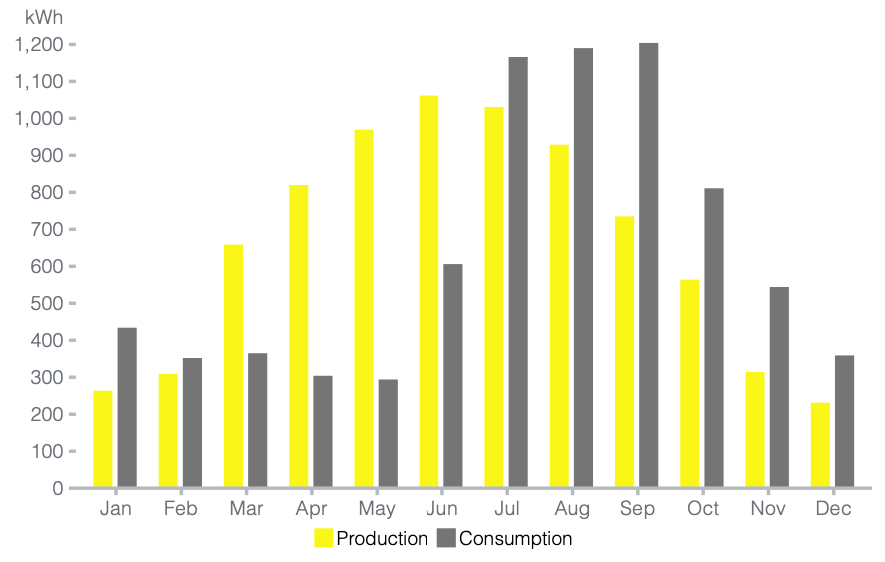
In this case, the solar PV production exceeds consumption during the spring and early summer, and the excess power is fed into the electric utility grid. For other times of the year, consumption exceeds solar production so the additional power needed is drawn from the electric utility. Over the course of a typical year however, the system in this example is sized so that the net production and consumption are roughly equal. So, for the purposes of financial analysis, the net energy bill savings is assumed to be an equal amount each month.
Cash Flow
Cash flow is a business concept that can easily be applied to your personal finances. Cash flow is the movement of money in and out of your business or, for personal finances, your wallet.
A cash flow diagram is a visual depiction of the money flow over time. When looking at investments that have a life in terms of years, it can be a useful planning tool.
Here’s an example cash flow diagram in bar chart form:
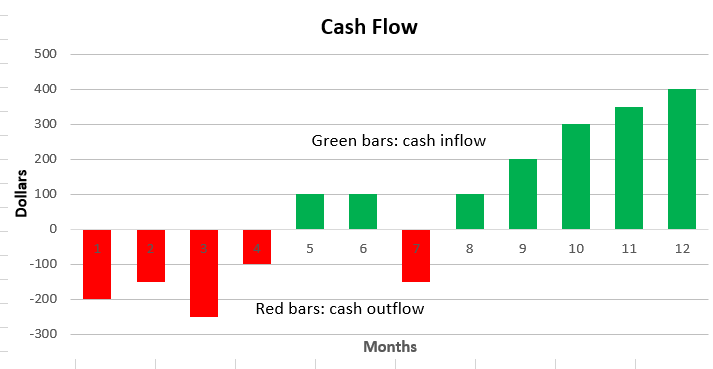
The horizontal time axis can be months, years or whatever increment makes sense. The vertical axis is money going out or coming in. Cash outflows (negative values) are shown as red bars. Cash inflows (positive values) are shown as green bars.
Here are the required inputs for the analysis of our example system:
- 7.2 kW system (sized to offset 100% of annual electric usage)
- Purchase price: $23,000 (60% due at signing, 40% at system startup)
- Federal tax credit: 30% of purchase price ($6,900)
- Annual electric usage: 7,700 kWh
- Electric cost: $0.15/kWh
- First full year electric savings: $1,155 (about $100/month)
- System assumed life: 25 years
The cash flow diagram for the first year of this investment:
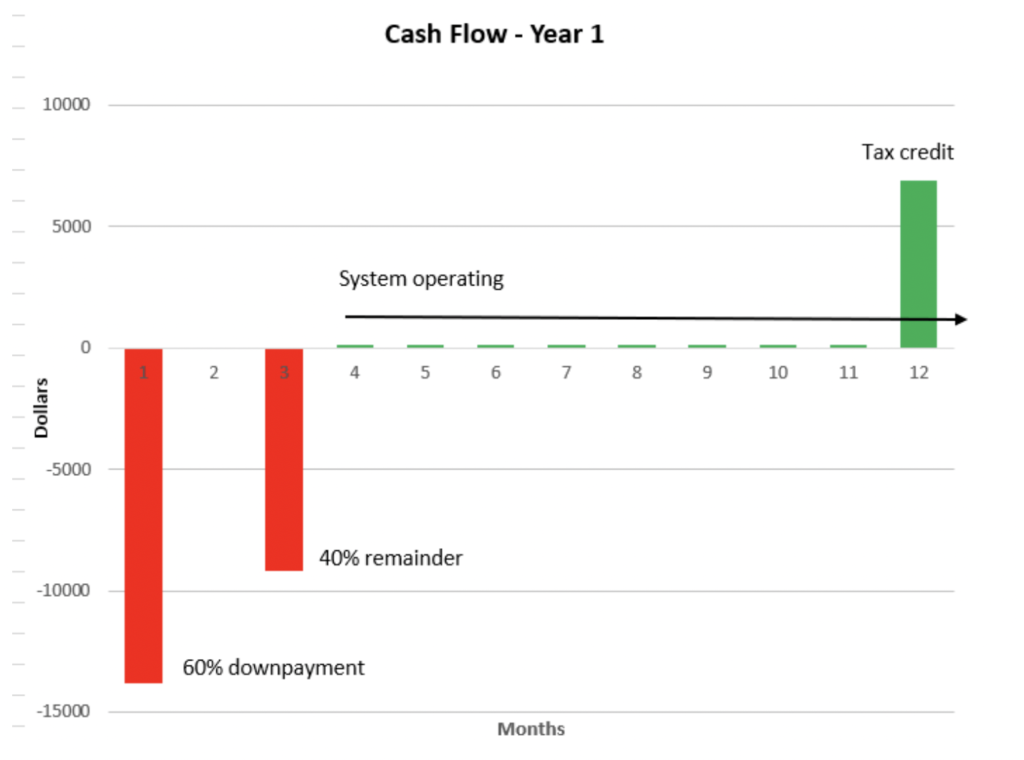
Note that from the time of purchase, it typically takes about 3 months before the system is installed and functioning. Time is required to get building permits, coordinate with the local utility, purchase and install equipment, and to test the system.
Net cash flow for the year is -$23,000 + $6,900 (tax credit) + $900 (energy savings) = -$15,200. So, you’re out a lot of cash in the first year, but the annual savings from the solar PV system keep going for the remaining 24 years (out of the assumed 25 years system life). The savings will increase if inflation of energy costs is factored in.
When looking at a long period of time for an investment of this type, a cumulative cash flow diagram is appropriate. Here’s the diagram for the full 25 years, assuming 3% annual inflation rate for energy costs:
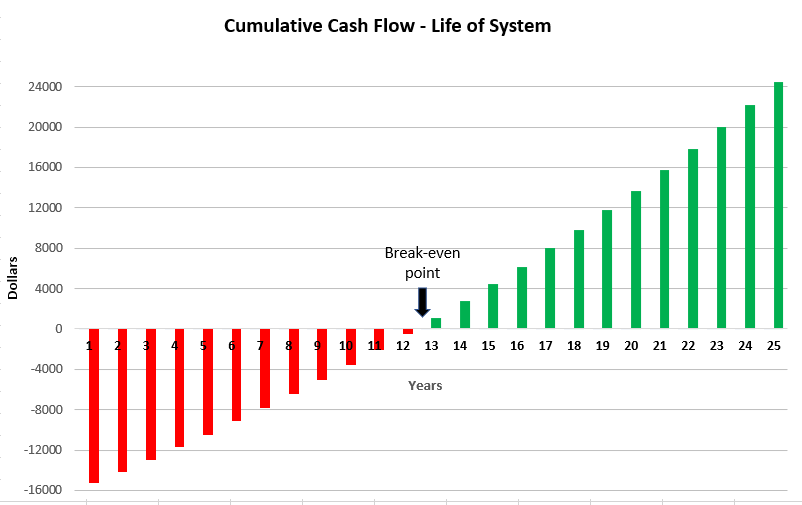
After 25 years this investment has resulted in a net inflow of $24,500. And, of course, the total 190,000 kWh of clean renewable power generated offset a lot of carbon dioxide, CO₂, that would otherwise have been emitted to the atmosphere.
- At the U.S. average of 0.85 pounds CO₂ per kWh[1], that’s about 161,000 pounds of CO₂ which is equal to 73 metric tons.
- A metric ton of CO₂ gas is a volume of about 25,000 cubic feet. A typical 60-passenger school bus has a volume of about 1,900 cubic feet. So, a metric ton of CO₂ would fill about 10 school buses. 73 metric tons is about 730 school buses full of CO₂!
Is it a Good Investment?
When you consider all the cash flow elements, is purchasing this PV system a good investment? From a purely economic perspective the key question is whether this investment returns more money than an alternative investment in something consistent with your level of risk tolerance.
As an example, let’s say you’re risk averse and prefer to invest your money in a savings account. You take the $16,100 ($23,000 less the $6,900 tax credit) you would have spent in the first year on the solar PV system and put that in a savings account currently paying 2% annual interest. . Using a spreadsheet, the cash flows for our example system yield a value of 8% for the rate of return after 25 years, a significantly larger return than 2% annual interest from the savings account. Over the full life of the PV system, it is a better investment than having the invested amount in a savings account.
However, if you were to sell your home after say 12 years, you would have only achieved a rate of return of -1% since you’ve not made it to the break-even point. You haven’t yet offset your initial investment. At this point, you may be able to make an additional return on your investment if the presence of the solar PV system increases the selling price of your home. At this time, some studies suggest an owned solar PV system increases the market value of a home by as much as $15,000 for an average sized system, but actual numbers will depend on local market conditions, appraisals, and the relative value local buyers place on clean energy projects.[2]
Will the System Last 25 Years?
With any exterior electrical system, sunlight (particularly ultraviolet radiation) and heat are enemies. The solar industry is experienced with designing equipment and systems that will withstand harsh conditions. Consequently, consumers should look for (and expect) strong warranties covering solar panels and power electronics, such as microinverters (which, in some systems, convert the DC output at each solar panel to AC).
Note that reputable solar panel manufacturers warrant both basic functionality and performance over time. The output of all solar panels degrades over time, perhaps 0.25 to 0.5% per year. Good quality panels are still able to provide 90% or more of their rated initial output after 25 years. However, warranty wording must be studied carefully so that you fully understand what is covered. This is a good reference on some of the caveats in warranties: https://www.solarconsumeradvisor.com/solar-warranties-guarantees-insurance.html
Ownership
A solar PV system is a big investment, so it is worthwhile to have the system checked out on an annual basis. If you don’t get the expected performance out of the system, you won’t get the return on your investment.
You should let your home insurance provider know that you have a PV system as soon as it is installed so that the system can be added to your coverage. Rooftop equipment is susceptible to damage from hail and lightning. As with any home system, supplemental insurance coverage from a third-party provider can also be considered.
Summary
This article highlighted an approach to analyzing the economics of a purchased solar PV system. The approach can be applied to other purchased energy-efficient systems.
The next article in this series will look at some other financial approaches to solar PV, including financing, leasing, and power purchase agreements which may play into whether or not this is the right investment for you.
[1] U.S. Energy Information Administration (EIA), FREQUENTLY ASKED QUESTIONS (FAQS), How much carbon dioxide is produced per kilowatt hour of U.S. electricity generation? https://www.eia.gov/tools/faqs/faq.php?id=74&t=11
[2] U.S. Office of Energy Efficiency and Renewable Energy, Homeowner’s Guide to Going Solar https://www.energy.gov/eere/solar/homeowners-guide-going-solar