
We’re Not Powerless, But Understanding This Complex Topic is Challenging
An Overview of Key Issues, Terminology, Current Status and Trends
NOTE: This article was originally posted on Medium, June 28, 2022
Climate experts from around the world agree that climate change is real and it is an existential threat to you and your family. If we don’t ramp up our efforts to curtail fossil fuel emissions, we’re heading towards a climate catastrophe. There is a wealth of information about climate change available from a variety of sources, and it can often feel overwhelming and insurmountable. The situation is dire, but not hopeless. There are things we all can do to combat climate change.
If you don’t believe these statements, don’t continue reading this article. This is not an attempt to dissuade climate change deniers. The threat is real, and we can’t “adapt” our way out of it. Rather, the purpose of this article is to help readers better understand the situation and science around climate change and where they as individuals can make a difference.
The latest report by the IPCC (the Intergovernmental Panel on Climate Change, the United Nations body created to assess the science related to climate change) estimates we’ve got an 8-year “window” in which to do something significant to keep global temperature rise at or below 1.5 ℃. “Significant” means to stabilize and lower global CO₂ (carbon dioxide) emissions.
Why is 1.5 ℃ important? If global warming reaches this level, there will be unavoidable increases in climate hazards that present multiple risks to people and ecosystems. We’ve already seen the effects on weather: higher temperature extremes (example: 49 ℃ / 120 ℉ in Delhi and several other parts of India recently), increased frequency and severity of floods and droughts, rising ocean levels and more frequent hurricanes. These weather changes will result in other problems such as severe food and water shortages, power outages and property damage.
Beyond a 1.5 ℃ increase, the intensity of all these problems is amplified.
Information Sources
Understanding the scope of climate change issues is difficult. Putting climate change into a personal perspective and sorting through the plethora of related information is even more difficult.
In trying to gain perspective and understanding, I thought the IPCC 6th climate change assessment report (designated AR6, approved in April, 2022) would be a good place to start. At 3,000 pages, however, it is not practical to read the full report. Even the summary of the report for policymakers is 63 pages long, and is not an easy read.
During my research, I discovered the IPCC’s “Frequently Asked Questions” (FAQ) webpage. This resource has three questions for each of the assessment report’s 17 chapters. Each question includes a download button that provides a one to two page excerpt from the report in PDF format. Here’s a link to the FAQ page. If you want to gain an understanding of the scope of the IPCC report, I recommend the FAQ resource as a starting point.
This article references information from the IPCC and draws upon other climate information sources.
Terminology and Conversions
The first challenge to understanding climate change information is understanding the terminology used. I have created a basic breakdown here.
Degrees celsius (℃): Throughout most of the world temperatures are measured in ℃. For readers who are more familiar with degrees Fahrenheit (℉), the relation is 1 ℃ = 1.8 ℉. So, a target such as limiting global warming to not more than 1.5 ℃ is equal to 2.7 ℉
Note: This is the conversion between degrees celsius and Fahrenheit. If you want to convert relative temperature, you need to account for freezing being 0 ℃ but 32 ℉. For example, to convert 30 ℃ temperature to Fahrenheit, the calculation is (1.8 x 30) + 32 = 86 ℉
Greenhouse gas (GHG): Greenhouse gasses absorb and emit radiant energy within the thermal infrared range, causing the greenhouse effect and associated global warming. Carbon dioxide (CO₂) is a GHG. Other gasses classified as GHGs, for example, include methane (CH₄), nitrous oxide (N₂O)and hydrofluorocarbons (HFCs). All GHGs are components of global warming, but CO₂ is predominant, making up roughly 80% of emissions as of 2018.
Global warming potential (GWP): A quantified gauge of the potential of each type of GHG to cause global warming, which can vary from gas to gas. This is one of the gas characteristics used in determining carbon dioxide equivalency (see below).
Giga-tons of carbon dioxide per year (GtCO₂ yr -¹): This is a widely used unit of CO₂ emissions. Giga is 1 billion (1,000 million), and tons are metric tons. (And yr -¹ is math jargon for “per year”.)
Metric ton: A metric ton is 1,000 kg, which is about 2,200 lbs. At standard air pressure and temperature, a metric ton of CO₂ occupies a cube that is 27 feet on each side¹, which is about 20,000 cubic feet of volume. To better visualize this volume:
- A home with 8 foot ceilings and 2,500 square feet of space contains about 20,000 cubic feet of air, roughly the same volume as a metric ton of CO₂
- A typical 60-passenger school bus has a volume of about 1,900 cubic feet. So, a metric ton of CO₂ would fill about 10 school buses.
Carbon dioxide equivalent (CO₂-eq): For analysis and comparison purposes, the concept of CO₂ equivalency is used in the IPCC report and other climate articles. CO₂-eq lumps together the various GHGs and applies a weighting to the environmental effects of each.
- Similar to CO₂ emission units, units of GHG emissions are stated as GtCO₂-eq yr-¹, which is Giga-tons of carbon dioxide equivalent, per year.
- This article from the Climate Change Connection provides further information about equivalency.
Net anthropogenic GHG emissions: Anthropogenic effects are caused by human activity. Net anthropogenic GHG emissions are determined by deducting natural source emissions from the total emissions amount measured or estimated. These are the emissions that we have the power to reduce through action and policy.
Current Status and Trends
The IPCC report states that over the past 20 years net anthropogenic GHG emissions have continued to rise, although the rate of growth between 2010 and 2019 was lower than for the period 2000 and 2009.
- Net anthropogenic GHG emissions for 2019 were 59 GtCO₂-eq, with a margin of error of +/- 6.6 GtCO₂-eq. (That’s a lot: about 600 billion school buses full of CO₂-eq)
- Burning fossil fuel (including industrial processes) generated about 38 GtCO₂ of these emissions
- GHG emissions for 2019 are 12% higher than 2010 and 54% higher than 1990.
The IPCC estimated 8-year window is based on an approximate “budget” of an additional 400 GtCO₂, an amount projected to result in a 67% chance of limiting warming to 1.5 ℃. Put another way, within 8 years or so, at the current rate of emissions, we’ll have used up the budget. This window is relatively short and unless there is concerted global action, it’s not enough time to solve our climate crisis. Ideally, we need to take actions that will stretch this budget while simultaneously making bigger changes to get away from practices that produce GHG emissions.
Even with this projected 8-year CO₂ budget, the World Meteorological Organization (WMO) projects there’s a 50% chance that global near-surface temperature will temporarily reach 1.5°C above pre-industrial levels during at least one year between 2022 and 2026. https://public.wmo.int/en/media/press-release/wmo-update-5050-chance-of-global-temperature-temporarily-reaching-15%C2%B0c-threshold
Is There Some Good News?
Well, yes, there’s some good news and there are some encouraging trends, but lots of work remains.
There are many countries where GHG emissions are dropping. Here are some examples:
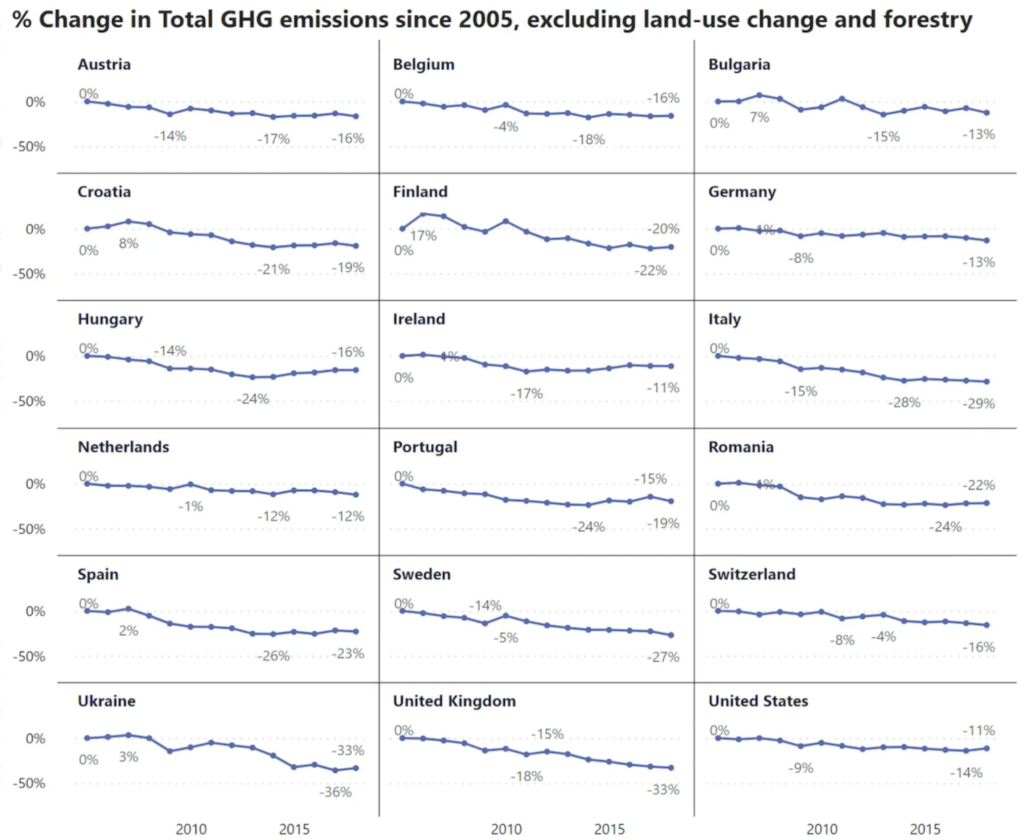
While this looks good, we can’t be complacent. These countries are responsible for about 30% of the global CO₂ emissions from fossil fuels. That’s a significant chunk, but many other countries are not doing as well.
For example, emissions in China and India, upon which much of the world depends for goods and services, are on an upward trajectory:
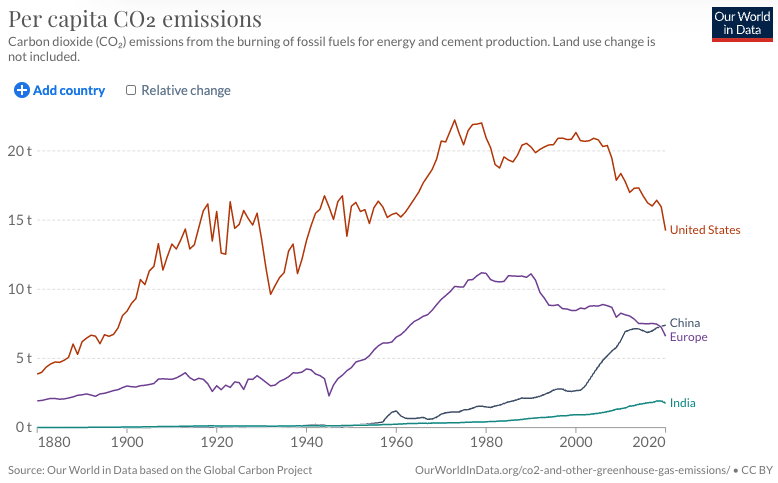
But, to its credit, China installed more offshore wind capacity in 2021 than what the rest of the world installed in the previous 5 years. India’s prime minister has pledged that it will increase its non-fossil fuel energy capacity from a current level of 157 GW (gigawatts) to 500 GW by 2030. So, while much work remains, there are some commitments in these countries to move towards lower emissions.
It’s not realistic to hope we can influence what happens in every single country, but international cooperation via the Kyoto Protocol (2008–2012) led to decreases in GHG emissions and the Paris Agreement has been a factor in many countries’ decisions to set mid-century targets of net-zero GHG or CO2 emissions.²
The use of clean alternative energy sources is increasing. For example, global solar energy capacity is at more than 700 GW.
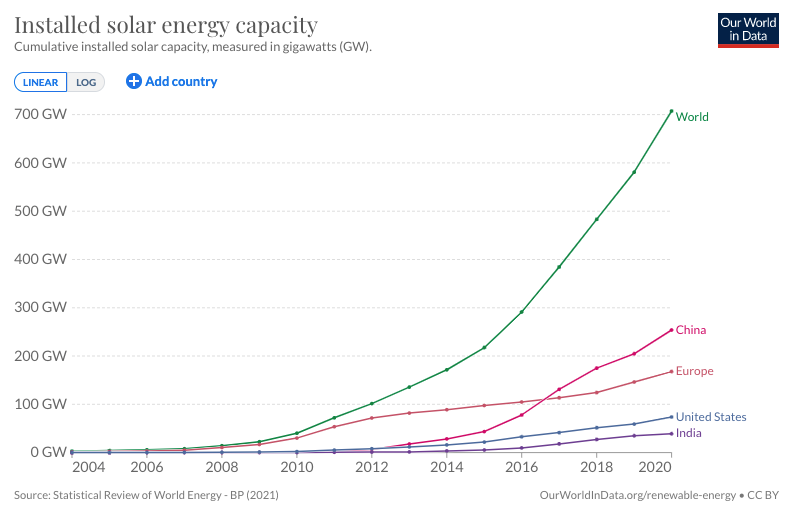
As the costs associated with alternative energy sources decrease, adoption will further increase.
- Over the past 15 to 20 years, unit costs for solar photovoltaic panels (PVs), wind turbines, concentrating solar plants and batteries for electric vehicles (EVs) have dropped significantly
- Adoption of PVs, wind turbines, and EVs has grown exponentially (although these sources still make up a small percentage of overall energy markets and use)
- Billions of dollars are being spent globally on development of battery technologies for energy storage that will further support use of intermittent energy sources like PV and wind.
Getting to Net Zero Emissions
All GHGs contribute to global warming and resulting climate change, but CO2 is the focus since it is the dominant factor. To stop global warming in the long term, reaching “net zero” CO₂ emissions from human activity is the key component. Reducing other GHG emissions is also desirable, but the IPCC recognizes that not all emissions can be eliminated.
It should be noted that getting to net zero CO₂ emissions, and sustaining that level, is sufficient to stabilize global warming. To decrease global warming, net negative CO₂ emissions and net zero or net negative GHG emissions are needed.
Carbon dioxide removal (CDR) is an example of a technology in development that takes CO₂ out of the atmosphere. There are numerous CDR pilot projects in operation and under construction. While encouraging, the scale of these projects is very small compared to the needed overall reduction in CO₂ emissions, and current costs per unit of CO₂ removed are too high for this to be a realistic solution right now. Consequently, CDR shouldn’t be considered as the answer to reducing atmospheric CO₂ or achieving net zero, but it is one potential component of the answer and could play a bigger role in the future.
The International Energy Agency (IEA) provides an overview of the different technologies being developed on this webpage. (Note that CDR is also referred to as direct air carbon capture, DACC or direct air capture, DAC). There are currently 19 plants operating around the world, with a plant capable of capturing 1 million tons of CO₂ per year scheduled to be operational in 2024.
Another approach to reducing CO₂ in the atmosphere is bioenergy with carbon capture and storage (BECCS). BECCS is based on carbon capture via plant growth (such as trees and crops), subsequent use of those plants as a source of energy, and long-term capture of carbon released when the plants are processed. While this more natural approach seems desirable, doing it at scale is controversial because the amount of land needed is quite substantial. ³
Globally, thousands of businesses have started disclosing their GHG emissions information to the public. In the United States, the Securities Exchange Commission has proposed rules that will require public companies to provide information on climate risk associated with their business, such as their GHG emissions history and climate-related targets going forward. These initiatives will help drive lower emissions in global commerce.
It’s important to note that there is no “silver bullet” solution. Technological solutions such as CDR and BECCS hold promise for future emission reductions and even net negative emissions, but they are not ready today.
In the short term, the world needs to keep reducing CO₂ emissions as quickly as possible. Clean energy sources and reduced consumption are the answers.
What Can Individuals Do?
The scale and intractable nature of climate change is a source of anxiety for many people. It’s understandable that an individual would feel helpless in dealing with this challenge, as much of the responsibility lies with policymakers and business leaders. However, there are positive actions that individuals can take to face the challenge, and doing something is better than doing nothing.
Here are some examples of actions you might consider if they are available and accessible for you:
Low cost or no cost:
- Recycle as much as you can and adhere to recycling guidelines
- Use public transportation
- Walk or use a bicycle
- Reduce your energy consumption. For example, turn off lights and appliances when not in use.
Political and volunteer:
- Vote for representatives who support clean energy and emissions reduction
- Contact your elected officials regarding the need for clean energy and emissions reduction
- Join activist environmental groups and participate in volunteer organizations
- Leverage social media to call for action and expose companies and politicians that aren’t on board
- Oppose new large-scale fossil fuel projects that have a projected life of more than 10 to 15 years
- Advocate for improved energy efficiency standards
Higher cost:
- Purchase alternative energy for your home or business
- Consider a hybrid, hybrid-electric, or electric vehicle
- Install solar panels on your home or property if you live where there’s adequate available sunlight
- Support and purchase from companies who have pledged to reach net zero and are actively working towards sustainability.
- Upgrade the insulation of your home
- Install LED lighting sources
- Go with higher energy efficiency ratings when you purchase home appliances
- Replace combustion engine yard maintenance equipment with rechargeable battery powered equipment
- Plant trees and native plants at your home or business
- Pay for personal carbon offsets if something sustainable is being created by the entity offering the offsets
This article from the NY Times provides some additional ideas and examples of individual climate change actions.
It’s easy to start feeling hopeless and lost when presented with the challenges of climate change. There is hope, and it starts with action. A multifaceted approach including technology, government policy, dedicated action in the private sector, and some individual responsibility is the best solution right now.
Instead of going down the rabbit hole of environmental doom, pick one thing you can do this week to improve our situation and do it. While larger action on the part of policymakers and business leaders is key, smaller actions of individuals can make a difference, too. You’ll feel better when you’re taking action instead of doom scrolling.
¹Kathryn Tso, MIT Environmental Solutions Initiative, “How much is a ton of carbon dioxide?”, December 2, 2020, MIT Climate Portal, https://climate.mit.edu/ask-mit/how-much-ton-carbon-dioxide
²IPCC AR6 WGIII FAQ, Chapter 14: International Cooperation
³IPCC AR6 WGIII FAQ, Chapter 7: Agriculture, Forestry, and Other Land Uses