
2022 Should Have Been Better – Key Indicators Show Little Progress
A Dashboard Overview
Perhaps 25 years ago, businesses discovered the value of creating a “dashboard” view of key performance metrics. It’s a great way to provide a visual overview of how a business is doing.
When I want to see how we’re doing in the battle against climate change and anthropogenic global warming (AGW), I look at three performance metrics:
- Global temperature data from Berkeley Earth
- Atmospheric CO2 (carbon dioxide) data from NOAA (U.S. National Oceanic and Atmospheric Administration) as measured at Mauna Loa, Hawaii
- Annual CO2 emissions from the latest carbon budget report by ICOS, the Integrated Carbon Observation System, created by the European Commission. This detailed report is updated annually.
There are, of course, many more metrics related to the physics of the atmosphere, global weather patterns and AGW. This is just one way to gain some perspective.
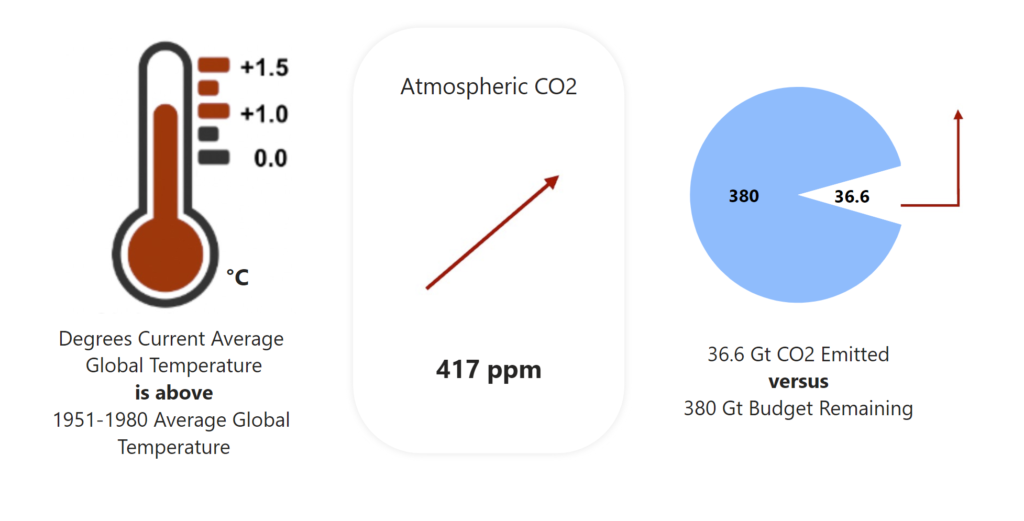
The dashboard view for the end of 2022:
Let’s drill down for more detail.
Global Mean Temperature
This is the latest graph of global mean temperature:
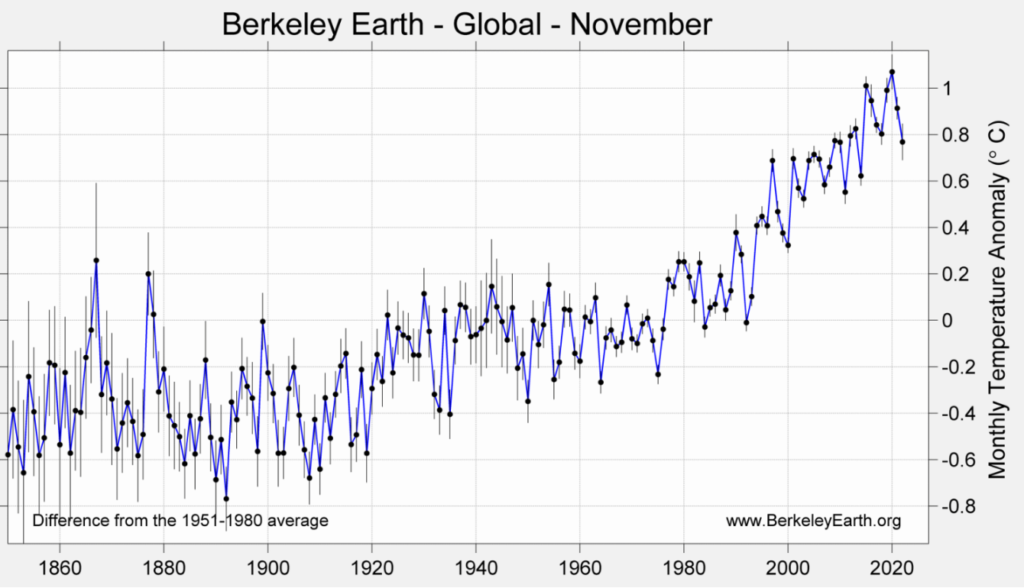
Seeing a decrease is encouraging. You can read the full explanation on the Berkeley website (link at the end of this article), but the key points:
- November was colder than October by 0.24 °C (0.43 °F) and was the coldest month of the year (with December results not yet available)
- It was the coldest month since February 2021
- The main driver was unusually cold conditions over land areas, particularly western North America, Australia and Antarctica
- If the trend line (since 1980) in the graph is extended, we’re about 1.0 °C above the 1951–1980 average. (Note that some climate reports use the pre-industrial age, 1850–1900 temperature as a benchmark. We’re 1.1 to 1.2 °C above that level.)
So, this decrease is most likely a result of extreme weather as opposed to a change in the long-term direction. 2022 was the 5th hottest on record according to the Copernicus Climate Change Service, an agency of the European Centre for Medium-Range Weather Forecasts.
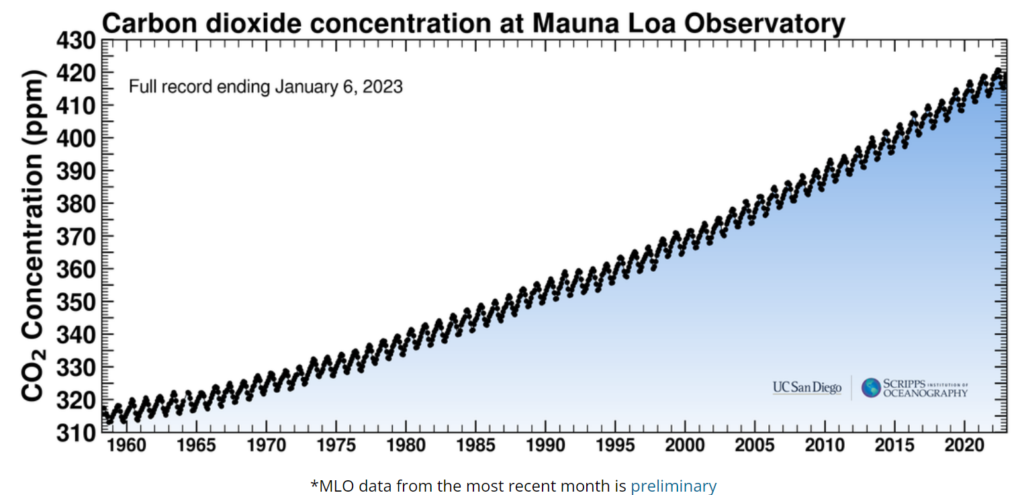
Atmospheric Carbon Dioxide
The eruption of the Mauna Loa volcano interrupted data acquisition at the monitoring site, so data from the University of Hawaii’s Maunakea Observatories are being used temporarily. Here’s the latest graph, which continues to indicate a steady rise in CO2 levels, with a current level of 417 ppm.
CO2 and Other GHG Emissions
This is a fairly complex topic that is covered in detail in the Global Carbon Budget 2022 by Pierre Friedlingstein et al. There’s a link to the full report at the end of this article.
Note on emissions units: Giga-tons of carbon dioxide per year (GtCO₂ yr -¹) is a widely used unit of CO₂ emissions. Giga is 1 billion (1,000 million), and tons are metric tons. (And yr -¹ is math jargon for “per year”.) A metric ton is 1,000 kg, which is 2,200 pounds.
Some of the key points from the report:
- Global fossil CO2 emissions are estimated to have increased in 2022 by 1.0 % relative to 2021. The emissions rate for the year is expected to be 36.6 GtCO2 yr−1.
- Emissions from coal and oil increased in 2022 relative to 2021 by 1.0 % and 2.2 % respectively.
- Emissions from gas decreased slightly (-0.2%). Geographically, these emissions in 2022 are expected to have decreased by 0.9 % in China and 0.8 % in the European Union, but increased by 1.5 % in the United States, 6 % in India, and 1.7 % in the rest of the world.
- The remaining carbon budget for a 50 % likelihood to limit global warming to 1.5°C has reduced to 380 GtCO2 for the beginning of 2023, equivalent to 9 years at the current emissions levels.
The last bullet is comparable to the IPCC’s estimate in April 2022 that the budget was 400 GtCO₂ associated with a 67% chance of limiting warming to 1.5°C.
Progress in 2022
The battle to decarbonize economies and stop or reverse AGW is one of incremental steps. The data for 2022 suggests little progress was made. If I were to assign a grade, the world would get a D-. We need to achieve significant decreases in fossil fuel dependency in every 12-month period going forward.
Despite the poor performance, there were some encouraging developments in 2022. Here are a few examples that offer reason for hope:
- The US Inflation Reduction Act of 2022 is a US$370 billion investment in energy security, including subsidies for companies pursuing clean energy technologies and incentives for consumers for things like electric vehicles, heat pumps and home insulation improvements
- Germany and Japan reconsidering nuclear energy phase-out plans. Germany’s nuclear plants provide only 6% of its total, but the country gets 31% from coal. So, it would help to keep nuclear going. Japan shut down all its nuclear plants after the Fukushima disaster, but the current government has set a goal for nuclear power to be at 20 to 22 percent of its energy mix by 2030.
- In the US, energy from renewables exceeded that from coal for the first time ever
- Electric vehicles (EVs) comprised 10% of all new cars sold globally
- Renewables and EVs need lots of batteries, and material costs are rising. That places increased importance on recycling. Redwood Materials announced plans for a $3.5 billion plant in Reno, with a goal of producing recycled material for 1 million lithium-ion EV batteries by 2025.
- The EU installed 41 GW of solar, a 47% increase over the 28 GW installed in 2021
- Brazil’s new president, Luiz Inácio Lula da Silva, has pledged to end deforestation of the Amazon
- China is planning to build a 43 GW facility in a particularly windy area of the Taiwan Strait. (For comparison, the US total wind capacity is 143 GW.)
Summary
Will the world hit and overshoot the 1.5°C limit? I don’t know since I’m not a climate scientist, but the temperature and CO2 emissions trends suggest that will happen.
To limit the overshoot past this target, a much more substantial effort would seem to be needed. A recent article (5 November 2022) in The Economist estimates annual global spending on clean energy and decarbonization needs to increase by 3X from the current $1T. Governments alone can’t come up with $3T, so private and public businesses need to get involved on a much greater scale. That requires financial incentives and simplified regulations. A tall order, for sure.
Are businesses getting more serious about decarbonization? Yes, according to the Science Based Targets Initiative (SBTi). Currently, over 4,300 businesses have committed to net-zero emissions targets. Collectively, these companies hold trillions of dollars in assets.
If we don’t see significant reductions in the next few years, the need for carbon removal becomes increasingly important. There are some pilot projects in progress for direct air carbon capture, but nothing is available yet at scale.
We’re heading into an important period of time where much greater effort is needed. Let’s hope we see the necessary commitment from governments and businesses.
As individuals, we’re not helpless. Individuals can work to influence energy policy makers to decrease regulation and increase incentives for renewable energy projects. Social media can be leveraged to encourage businesses and brands to commit to lower emissions and decreased fossil fuel dependency. Individuals can encourage local community initiatives such as load aggregation with clean energy providers and development of microgrids. Step up and get involved!
Information sources and links to go deeper on the topics in this article:
- Temperature data from Berkeley Earth: https://berkeleyearth.org/november-2022-temperature-update/
- Climate data from NOAA:https://www.noaa.gov/news-release/university-of-hawaii-noaa-to-gather-climate-change-data-following-mauna-loa-eruption
- The full ICOS carbon budget report: https://essd.copernicus.org/articles/14/4811/2022/
- The The Science Based Targets initiative (SBTi) FAQ: https://sciencebasedtargets.org/faqs#what-are-science-based-targets
- Copernicus Climate Change Service: https://climate.copernicus.eu/global-climate-highlights-2022
- Redwood Materials batteries recycling: https://www.redwoodmaterials.com/